Org & R via Babel Example
1. Overview
The following is a quick example of a document created in org-mode which uses org-babel to allow inline R code to produce graphs.
2. Alphabits
I like cereal, especially when it spells.
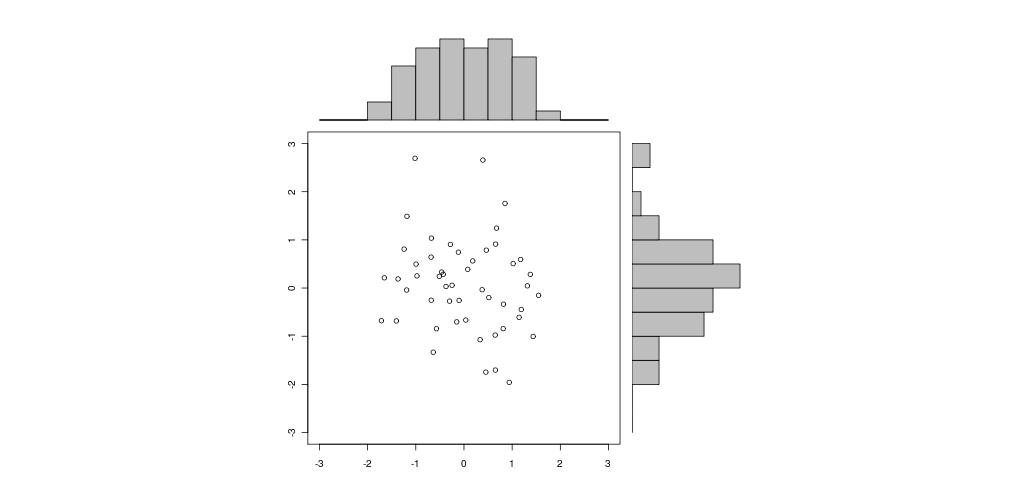
Graph courtesy of http://addictedtor.free.fr/graphiques/sources/source_78.R
 # Data from org
 doublePlot = function (base, plotFunc,
                       pngopts = c( width = 1024, height = 500 ),
                       pdfopts = c( width = 10, height = 7.5, paper = 'usr')
                       ) {

  # basename from org-babel
  myPng = paste(base,"png",sep=".")
  myPdf = paste(base,"pdf",sep=".")

  png(myPng, pngopts )

  plotFunc()

  dev.off()

  pdf(myPdf, pdfopts)

  plotFunc()

  dev.off()

}


  doublePlot(base=basename, plotFunc = function() {
    x <- pmin(3, pmax(-3, rnorm(50)))
y <- pmin(3, pmax(-3, rnorm(50)))
xhist <- hist(x, breaks=seq(-3,3,0.5), plot=FALSE)
yhist <- hist(y, breaks=seq(-3,3,0.5), plot=FALSE)
top <- max(c(xhist$counts, yhist$counts))
xrange <- c(-3,3)
yrange <- c(-3,3)
nf <- layout(matrix(c(2,0,1,3),2,2,byrow=TRUE), c(3,1), c(1,3), TRUE)
#layout.show(nf)

par(mar=c(3,3,1,1))
plot(x, y, xlim=xrange, ylim=yrange, xlab="", ylab="")
par(mar=c(0,3,1,1))
barplot(xhist$counts, axes=FALSE, ylim=c(0, top), space=0)
par(mar=c(3,0,1,1))
barplot(yhist$counts, axes=FALSE, xlim=c(0, top), space=0, horiz=TRUE)


  })
3. Thanks!
Org-mode rocks.