Maxima Source Code Blocks in Org Mode
Org Mode support for Maxima

Introduction
Maxima is a computer algebra system descended from Macsyma, which was originally released in 1982. It is released under the terms of the GNU General Public License.
Maxima is written in Common Lisp. It can be accessed and extended in Lisp.
Requirements and Setup
Maxima binaries are available for Windows and Linux. These either require a compatible Common Lisp or an executable Lisp image. Mac OS X users can install via brew or MacPorts. The combinations of operating system and Lisp implementation known to run Maxima can be found on the Maxima ports page.
There are several versions of Maxima, some with different names. The
variable org-babel-maxima-command can be set to the name of your
Maxima executable. The default value is "maxima".
Maxima ships with Emacs modes. Instructions for configuring them
can be found on emacswiki. imaxima is an Emacs front end with
image that displays fully typeset math in your Emacs window.
You must activate Maxima by adding a line to
org-babel-load-languages:
(org-babel-do-load-languages
 'org-babel-load-languages
 '((maxima . t))) ; this line activates maxima
Org Mode Features for Maxima Source Code Blocks
Header Arguments
There are no Maxima-specific default header arguments.
There are two Maxima-specific header arguments:
:batch- This can be set to one of Maxima's source-code loaders:
batch,loadorbatchload. The default loader isbatchload. :graphics-pkg- This can set to one of Maxima's graphics
packages:
draworplot. The default package isplot.
If a :file filename.ext header argument is provided to a Maxima
source block, in conjunction with a :results graphics file header
argument, then the graphics device is determined from the file-ending
ext. For the plot package, the following graphics devices (gnuplot
terminals) are supported:
png, pdf, ps, svg.
The draw package supports these graphics devices:
png, jpg, gif, eps, svg, pdf.
The header argument, :cmdline, can be used to pass command line
arguments to Maxima.
Sessions
Org-mode support for Maxima does not include sessions.
Result Types
Maxima produces the full range of result types.
Examples of Use
Calculator
The following source code block uses maxima as a calculator for
powers of 12, where the powers are passed with a variable.
#+name: test-maxima
#+header: :exports results
#+header: :var x=1.3121254
#+begin_src maxima
  programmode: false;
  print(12^x);
#+end_src
HTML export of the result:
26.06280316745402
Solver
Of course, maxima is more than a calculator.
#+name: solve-maxima
#+header: :exports results
#+begin_src maxima :results output
  programmode: false;
  eq: x**2-16 = 0;
  solution: solve(eq, x);
  print(solution);
#+end_src
HTML export of the result:
solve: solution:
                                    x = - 4
                                     x = 4
[%t1, %t2]
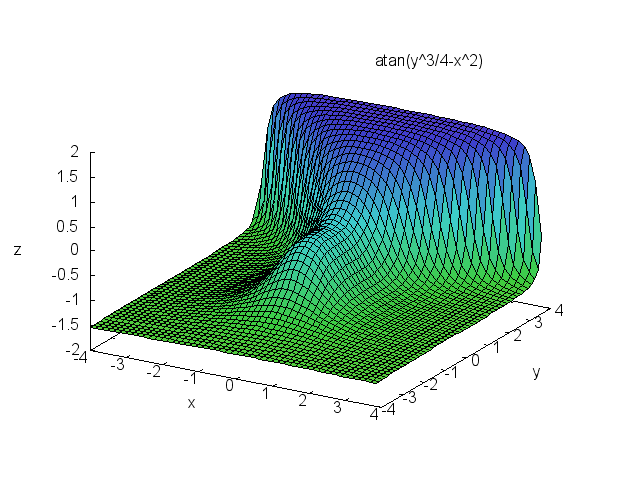
3D plots
With gnuplot installed (4.0 or higher), 3D graphics are possible.
This example is from a tutorial on the maxima/gnuplot interface.
#+name: 3d-maxima
#+header: :file images/maxima-3d.png
#+header: :exports results
#+header: :results file graphics
#+begin_src maxima
  programmode: false;
  plot3d(atan(-x^2+y^3/4),[x,-4,4],[y,-4,4],[grid,50,50],[gnuplot_pm3d,true]);
#+end_src
HTML export of the Maxima code block result:
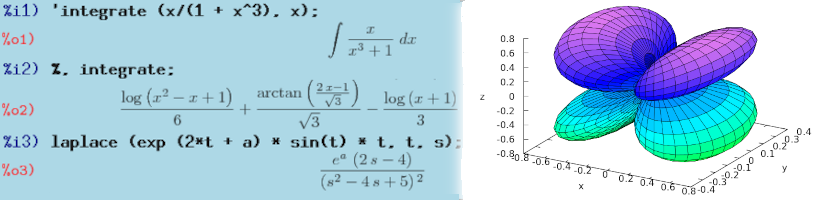
Inline Display of Maxima LaTeX Output
The :batch header argument
Setting the :batch header argument to batch:
- allows the use of the
:lispreader; - provides a more verbose output;
- allows one to typeset calculations in LaTeX.
An example with the :lisp reader
Sample code block:
#+BEGIN_SRC maxima
(assume(z>0), integrate(t^z*exp(-t),t,0,inf));
:lisp $%
#+END_SRC
The first line of input computes the integral \(\int_0^{\infty}
t^z\,e^{-t}\,dt\), assuming that \(z\) is positive. The second input
line uses the :lisp reader to print the internal representation of
that result as a sexp.
HTML export of results:
(assume(z > 0),integrate(t^z*exp(-t),t,0,inf))
                                 gamma(z + 1)
((%GAMMA SIMP) ((MPLUS SIMP) 1 $Z))
An example with line numbering
By default, the command-line option --very-quiet is passed to the
Maxima executable; this option suppresses the output of the start-up
banner and input/output labels. That can be modified by setting
:cmdline --quiet, which allows printing of input/output labels.
Sample code block:
#+BEGIN_SRC maxima
rat(1/(x+1) + x/(x-1));
#+END_SRC
HTML export of results:
(%i1) rat(1/(x+1)+x/(x-1))
                                  2
                                 x  + 2 x - 1
(%o1)/R/                         ------------
                                     2
                                    x  - 1
Maxima's default is to print input in linear (or 1d) fashion, while output is printed in 2d.
LaTeX output
To produce LaTeX output for an extended computation, one needs to
set-up a LaTeX printer. This example uses the alt-display package
to do that. To print output as LaTeX, Maxima's 2d printer is replaced
with org_tex_display; to ensure input lines are not echoed, its 1d
printer is replaced with a sink, org_no_display (see also this
Note).
Tangle this code block (C-u C-c C-v t):
#+begin_src maxima
#$(load("alt-display.mac"),
define_alt_display(org_no_display(output_form), ""),
define_alt_display(org_tex_display(output_form),
block([],
printf(true,"~&#+begin_example~%(~a~d)~%",outchar,linenum),
printf(true,"~&#+end_example~%"),
tex(second(output_form)))),
set_alt_display(2,org_tex_display),
set_alt_display(1,org_no_display));#$
#+end_src
Next, write a Maxima code block that sets the :cmdline header to
read in the initialization code that was just tangled.
#+BEGIN_SRC maxima
(assume(z>0), 'integrate(t^z*exp(-t),t,0,inf) = integrate(t^z*exp(-t),t,0,inf));
diff(%,z);
#+END_SRC
HTML export of the results:
(%o1)
\[\int_{0}^{\infty }{t^{z}\,e^ {- t }\;dt}=\Gamma\left(z+1\right)\]
(%o2)
\[\int_{0}^{\infty }{t^{z}\,e^ {- t }\,\log t\;dt}=\psi_{0}(z+1)\, \Gamma\left(z+1\right)\]
Note
Prior to version 5.47, Maxima could only pre-load a lisp
file; to get around this constraint, the Maxima code is written into a
lisp file, and the #$ reader macro is used to read the Maxima code.
In versions 5.47 and higher, the Maxima code can be put in a .mac
file and pre-loaded without the need for such tricks.
The :graphics-pkg header argument
The :graphics-pkg header argument can be set to use either Maxima's
built-in plot package (the default), or the draw package.
The plot package
The plot package is the default package that provides a simplified
interface to gnuplot. Here is an example that creates a gif file.
#+begin_src maxima
plot2d( sin(x), [x,0,2*%pi]);
#+end_src
HTML export of the results:
plot.The draw package
The draw package has more features than plot, including an
object-oriented interface to several graphics engines, including
gnuplot. Here is an example that creates an svg file containing
the graph of a discontinuous function.
#+begin_src maxima
f(x) := if x>0 then cos(x) else if x<0 then 0;
draw2d(
line_width=2, grid=true, yrange=[-1.2,1.2],
explicit(f,x,0,%pi), explicit(f,x,-1,0),
fill_color=white, ellipse(0,0,0.05,0.05,0,360),
fill_color=blue , ellipse(0,1,0.05,0.05,0,360));
#+end_src
HTML export of the results:

draw.Additional Notes
Toggle inline display of latex code
Latex code in org mode can be displayed inline by 'C-c C-x C-l'. To remove the inline display 'C-c C-c' is used. This is described further in the manual 2.
Set scale of output
If the inline display of the equations are illegible, the scale can be set by customising the variable 'org-format-latex-options', by setting the :scale variable to a value >1.
Export
Noweb expansion
NOTE: I have not tested this yet, but as Eric Schulte noted on the mailing list: "Alternately, if you really want to get fancy you could use noweb expansion 5 to insert the results of the imaxima code block into a latex code block, and then use the existing latex code block functionality to convert the imaxima output to images of different types depending on the export target." 6